


|
|
|
![]() Introduction
Introduction
![]() Hypothesis
Hypothesis
![]() What
can go wrong
What
can go wrong
![]() Gathering
the Data
Gathering
the Data
![]() Presenting
the Data
Presenting
the Data
![]() Getting
results
Getting
results
What is the Spearman Rank
Correlation Coefficient ?
The Spearman Rank Correlation Coefficient is used to discover the strength of
a link between two sets of data. In this example we will look at the strength
of the link between the distance across a meander and the depth of the river.
When written in mathematical notation the Spearman Rank formula looks like this
:
The hypothesis must be written in a clear and concise way so that other people can easily understand the aims of the investigation.
We would expect to find that the depth of the water increases as distance from the inner bank of the meander increases. In otherwords, the deeper water will be found on the outside of the meander.
The hypothesis might be written like this.
The depth of the river does not progressively increase as the distance from the inner bank of the meander increases.
Note that the hypothesis states that there will be no relationship between the distance and increasing water depth. Such an hypothesis is called a 'null hypothesis'. This is the way in which an hypothesis should always be written when conducting research.
Having decided upon the wording of the hypothesis, the researcher should consider whether there are any other factors that may influence the study.
Looking again at the example of river depth and distance from the bank, the following additional factors could be considered. This is not a full list, just a group of examples.
a) Is this a 'natural' river or has it been subjected to human intervention such as flood control, dredging or water extraction?
b)What is the river bed made of? Rivers running on solid rock are less likely to demonstrate depth changes due to erosional forces than those running over softer materials such as alluvium or pebbles.
c) How far apart are the measurements going to be ? A spacing of 50cm was used in the example since this is often a good compromise between work load and amount of detail. Spacing of 10cm would give more detailed information, but would require many more measurements.
The researcher should mention such factors in their project. Reference should always be made to any factors which may influence the results of the investigation.
The hypothesis is written, the study area has been chosen and as many as possible of the potential problems have been solved. The practical part of the research can now begin.
Before you start gathering data be sure you know exactly what you need to record. Decide upon a way in which you will write down your results,and make sure that you do write them down immediately. Don't rely on memory - it isn't worth it, especially when dealing with numbers.
Remember that conditions can change from day to day, so try to collect data under similar conditions all the time. This is especially true when dealing with rivers, where a change in weather can dramatically alter the data being gathered.
In our example, you would need to record, at each sample site, the following data.
1) The number of the site.
2) The distance from the inner bank of the meander at regular intervals across
the river
3) The depth of the water at regular intervals across the river
The data should be clearly recorded. If you abbreviate anything make sure you know what your notes mean. You may want to read your notes in a few months time!
Data in the form of numbers ( numerical data ) can be presented as either graphs or tables.
When using Spearman Rank the data is best presented as a table. It is a good idea to prepare an empty table before you start to do any calculating. That way, you can enter your calculations straight into the table as you do them. You thus save time and avoid making mistakes.
The table below uses our example of river width and depth across a meander. The maths involved in completing the table is very basic, and gives all the values you need for entering into the Spearman Rank formula.
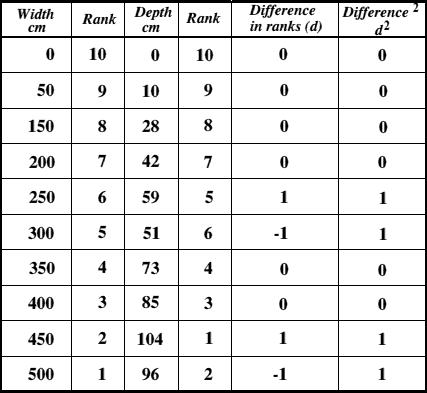
The first thing to do is to enter the data you have recorded.
Distance across the river from the bank is easy since it is a progression in
50cm jumps. The depth readings for each location are then entered in the depth
column.
Ranking is achieved by giving the ranking '1' to the biggest number in a column,'2' to the second biggest value and so on. The smallest value in the column will get the lowest ranking. This should be done for both sets of measurements.
The remainder of the table can then be filled in. Lets look at each entry in turn.
1) Difference in ranks : This is the difference between the ranks of the two
values on each row of the table. The rank of the second value (depth) is subtracted
from the rank of the first (distance from the bank).
Using our example table and looking at the values recorded 300cm from the bank
you can see that the width is ranked 5, and the depth is ranked
6.
This gives a difference in ranks of 5 - 6 = -1.
To remove such negative values, square the difference in the next
column. This removes any negative numbers.
a)Now to put all these values into the formula.
Find the value of all the d² values by adding up all the values in the Difference² column. In our example this is 4. Multiplying this by 6 gives 24.
b) Now for the bottom line of the equation.
The value n is the number of sites at which you took measurements. This, in our example is 10. Substituting these values into n³ - n we get 1000 - 10.
c) We now have a formula like this...
R² = 1 - (24 / 990) which gives a value for R² of 0.9757.
This value doesn't mean much on its own. It must be looked up on a Spearman Rank significance Table. In our example, the value 0.9757 gives a significance level of better than 0.01. That means that the probability of the relationship you have found being a chance event is less than 1 in a 100. You are over 99% certain that your hypothesis is wrong.
REMEMBER !!!
The hypothesis states that the relationship you have been studying DOES NOT exist. If the hypothesis is wrong , then the relationship DOES EXIST.
![]()
We value
your ideas and suggestions. Please contact the
maintainer of this site.
This page
can be found at: http://www.geography-site.co.uk
Last update to
this statement was on:
February 20, 2006
© Copyright Geography Site